Hiroshi Watanabe
A Very Long Hill

‘The Purchase of Manhattan Island by Peter Minuit, 1626’ by Alfred Fredericks.
In 1626, so the story goes, the native Lenape people sold the island of Manhattan, to the Dutch East India Company for 60 guilders worth of trinkets, the supposed equivalent of $24. A famously bad trade for the tribe given the island’s current estimated value of well over a trillion dollars.
But Warren Buffett tells it differently. In one of Berkshire Hathaway’s early reports, he suggests that with the right investment approach, the tribe might have won the better deal. Had they compounded their $24 of takings at 6.5% real over the (what is now) 397 years, they’d have stockpiled $1.7 trillion. Enough to buy back their island, even at today’s prices, with billions in change. How? Jeremy Siegel’s Stocks for the Long Run provides the answer: equities, or US stocks specifically, which have compounded away at close to this real 6.5% rate¹ for as far back as his records go. In other words, the Lenape investment committee would have needed no deep insight, no special hedge fund access, no venture capital networks; just a steady long-term equity allocation. To quote a more recent Buffett letter, “America has been a terrific country for investors. All they have needed to do is sit quietly, listening to no one.”
Obviously, this didn’t, and in practice likely couldn’t have happened. But even a more tangible proposal, say the compounding of a family’s invested wealth into billionaire status ($250k at a real 6.5% for 133 years would do it) is rarely accomplished. One reason being that despite the common focus on beating the market, many investors fail even to match its long-term rate of return.
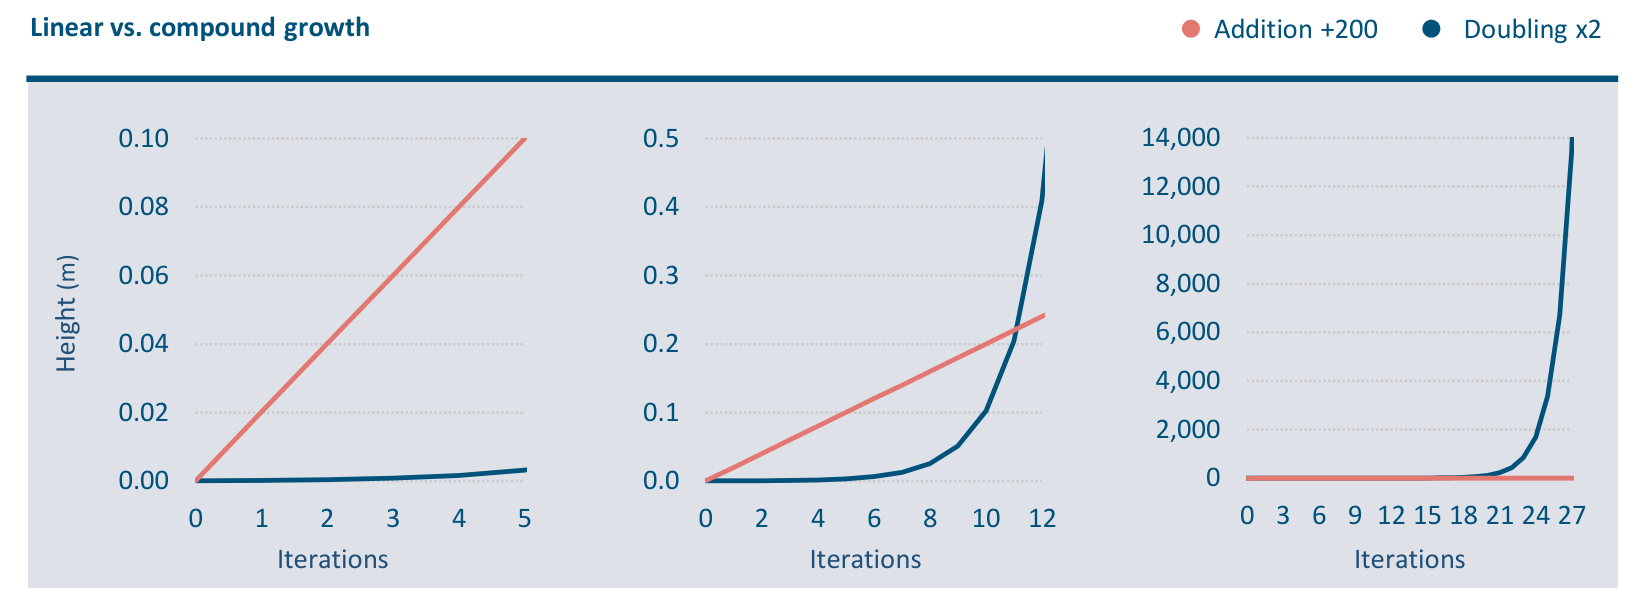
| Figure 1: The resultant height in metres of a paper pile after 5, 12, and 27 iterations of either stacking (adding 200 sheets, the pink lines) or folding/doubling (the blue lines) the implied height, starting in both cases with a single 0.1mm thickness sheet. |
Several studies, the best-known being Morningstar’s annual Mind the Gap report, show that the actual dollar- weighted returns earned by individual fund investors are much lower than the buy-and-hold time-weighted returns from the funds themselves. This impacts both active and passive approaches, with the average US fund investor earning 1.4% p.a. less than even the index funds they buy². Most savers don’t (or can’t) stay fully invested, resulting in ‘time out of the market’ and behavioural traps for those ‘timing the market’. The ‘gap’ might not sound like much, but it costs the compounder greatly. In our prior example, cutting the real return from 6.5% p.a. to 5.1%, reduces the Lenape’s imagined final hoard from trillions, down to a modest $9 billion. Buildings, not cities. As Brad Barber & Terrance Odean noted in an influential Journal of Finance paper on this topic, “Individual investors who hold common stocks directly pay a tremendous performance penalty for active trading.. Our central message is that trading is hazardous to your wealth.”
Even perfect buy-and-hold passive investors experience effective turnover. Cap-weighted indices like the MSCI World or S&P500 (SP500, SPX) suffer a surprising amount of activity as new companies are added, removed, or rebalanced by index committees. The S&P500 has seen well over 1,000 name changes since its inception, whilst the more comprehensive Center for Research in Security Prices database of US stocks boasts an annualised name turnover of nearly 8%. Does this activity add value? Not necessarily, as another Siegel study suggested. As of 2006 when the work was published, he calculated that if you’d bought the original S&P500 at launch in 1957 and then did nothing, you’d have beaten the actual, regularly refreshed S&P by more than half a percent per annum. Similarly, the Voya Corporate Leaders Trust, launched in 1935 (with explicit rules to prohibit turnover) hasn’t added a single new holding in 87 years, yet delivered double-digit nominal compound returns³.
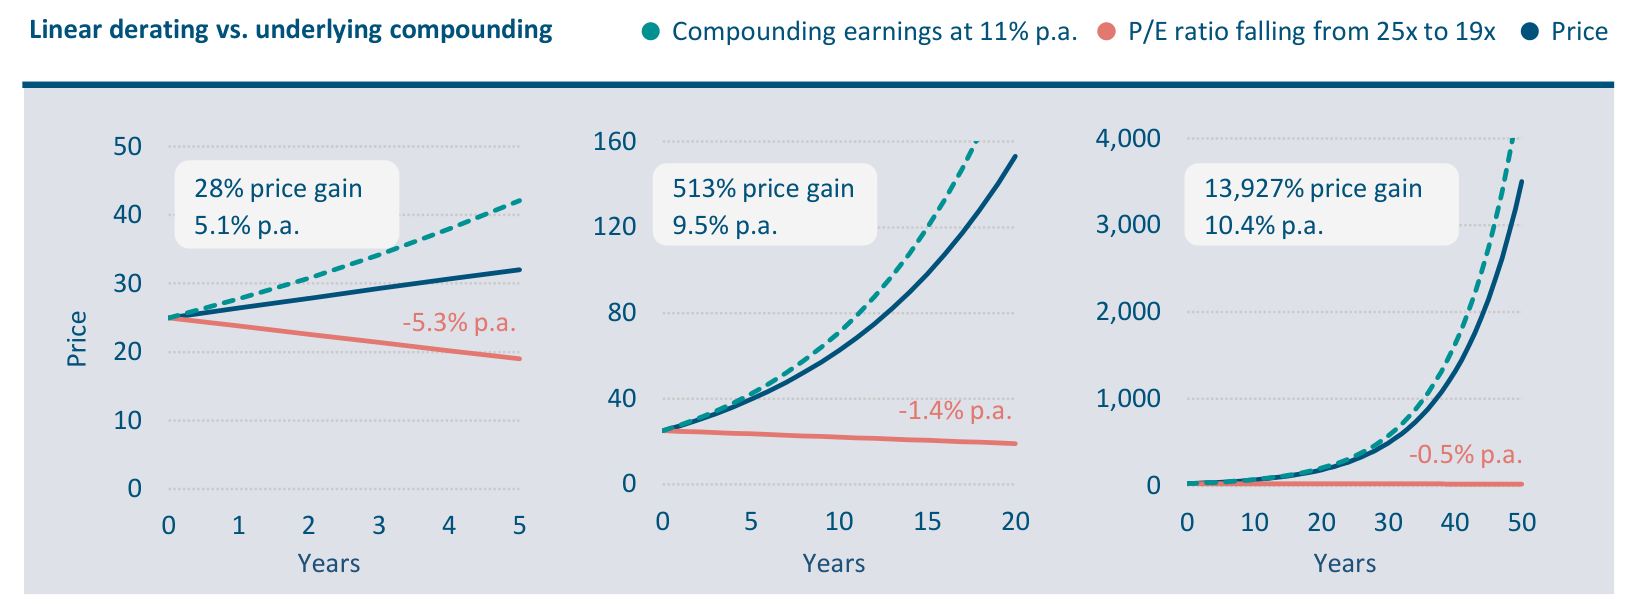
| Figure 2: Linear derating vs. compound growth over three separate time horizons. As per the prior example, these charts illustrate three different holding periods over which the P/E multiple on an initial unit of earnings declines a fixed 24% from 25x to 19x (the pink line illustrates this absent earnings growth). This annualises to -5.3% over five years, -1.4% over 20 and -0.5% over 50 years, allowing an earnings/dividend stream compounding at 11% (the dotted green lines illustrate this absent the change in ratings) to deliver price returns (the blue lines) of 28%, 513% and 13,927% respectively. |
Compounding only really works if uninterrupted. An effective way to illustrate the impact and importance of time here is to compare compounding or geometric growth, with an alternative, more common form, such as linear or arithmetic growth. So, growing by a fixed percentage each time vs. growing by a fixed amount each time. The best-known example here is paper folding vs. paper stacking. This is illustrated on the three charts on the prior page (Figure 1), giving the resultant height of a paper pile from either folding it (which doubles or geometrically compounds on the previous growth) or stacking it (linearly adding a fixed number of sheets – say 200 at a time) after 5, 12 or 27 iterations.
After five additions, the stacked paper pile (pink line) clearly leads. After 11, the compounding, folded pile (blue line) overtakes. By 13, it’s a metre high, by 14, two metres and so on. By 27 folds, the paper pile – initially just a 10th of a millimetre tall – towers over Mount Everest. 42 folds takes you to the moon, 100 and you’re outside the observable universe. Granted these numbers are hard to make intuitive sense of, but don’t underestimate their potential.
The two critical ingredients for compounding are the rate of growth, and its duration. At Lindsell Train we look for above market rates of compounding and then do our best not to interrupt them. In 13 years of running our Global Equity Representative account we have kept our annualised turnover below 5% (less than some passive indices!) and excluding takeovers sold just six stocks. Alongside this, by focusing on high-returning businesses, we’ve sustained an internal rate of compounding (e.g., the return on equity) within the portfolio at nearly double the rate of the average company, whilst our businesses have seen dividends per share compound at a higher rate in response (which we calculate as c.11% vs. the wider market average of c.6%).
Is this ‘quality’ already priced in? Our companies typically trade at premium valuations to the average – currently c.25x historic earnings for our Global Strategy vs. the MSCI World’s average of c.19x. If this situation were to reverse, might this override the advantage of a higher rate of compounding? In the short run, yes. Longer-term however, this turns out to be another case of geometric vs. linear change.
For buy-and-hold investors, paying a higher multiple means both a lower initial dividend yield and, if the multiple falls over the holding period, a headwind to price appreciation. The second of these, the prospect of derating, perhaps worries investors the most. However, its impact is highly dependent on the time horizon as the above charts (Figure 2) will show.
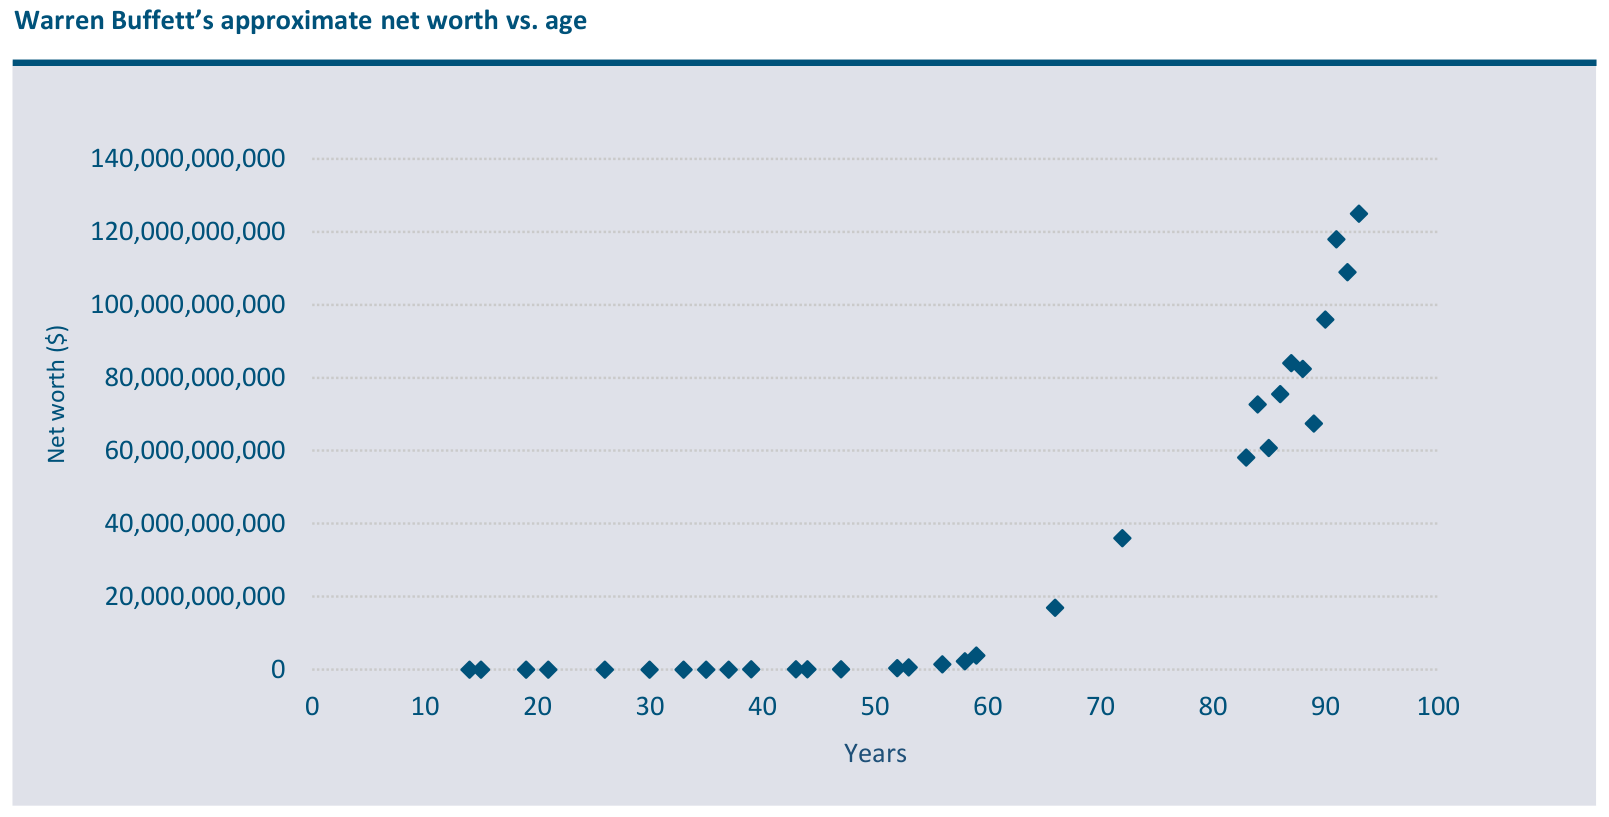
| Figure 3: Warren Buffett’s USD net worth vs. age as calculated by Forbes (2024). Note the classic compounding curve when viewed on linear axes, and the apparently dramatic jump in wealth in recent decades. |
Imagine a scenario, where earnings or dividends compound steadily at an 11% p.a. rate (the green dashed line in each of these graphs) but the price-earnings (P/E) ratio falls from the premium 25x to a market 19x (as represented by the pink lines). That’s a 24% drop in the multiple, which over one year would be quite painful. The underlying compounding would be barely noticeable, and your price return an unpleasant 16% loss.
But the derating impact is linear and that takes much of the bite out of it – if you’re prepared to hold on through. And here, as with the prior example, it really is the longer the better. Turning to the charts in Figure 2, on the left is that 24% drop over five years, which annualises to a 5% p.a. headwind, allowing the compounding earnings to produce a middling 28% price gain, or 5.1% p.a. (shown in blue). Over 20 years, on the second chart, the p.a. headwind is just 1.4%, whilst the compounding delivers a 6.1-fold price return equivalent to 9.5%
p.a. before dividends. Over 50 years, to really stretch the point, you’re looking at a price return of 140-times or 10.4% p.a. The longer you wait, the more the compounding of earnings dominates over the linear derating. As Buffett once said, “The nature of compound interest is it behaves like a snowball of sticky snow.. The trick is to have a very long hill.”
But what about the lower starting yield? This indeed makes a difference; with an assumed 50% payout ratio, 24x earnings equates to a 2.0% dividend yield, notably lower than the 2.6% yield implied by a multiple of 19x. But whilst this 0.6% headwind will add up over time (assuming dividends are reinvested and hence compounded), such derating can be easily overwhelmed by a faster pace of price appreciation (e.g., vs. an index growing earnings or dividends at 6% p.a.).
Interestingly, such long-termism has many advocates, yet seemingly few adherents: the Refinitiv Lipper database gives the median turnover of a US mutual fund as 39%, implying a holding period of just 2.5 years. Why? One answer is the crucial requirement for patience. Buffett himself, whose net worth chart (Figure 3) also follows a classic compounding curve, gained more than half of his 12-figure fortune in his eighties. Not everyone wants to wait that long. When asked by Jeff Bezos why his simple investment thesis was so rarely copied, Buffet replied, “Because nobody wants to get rich slow.”
|
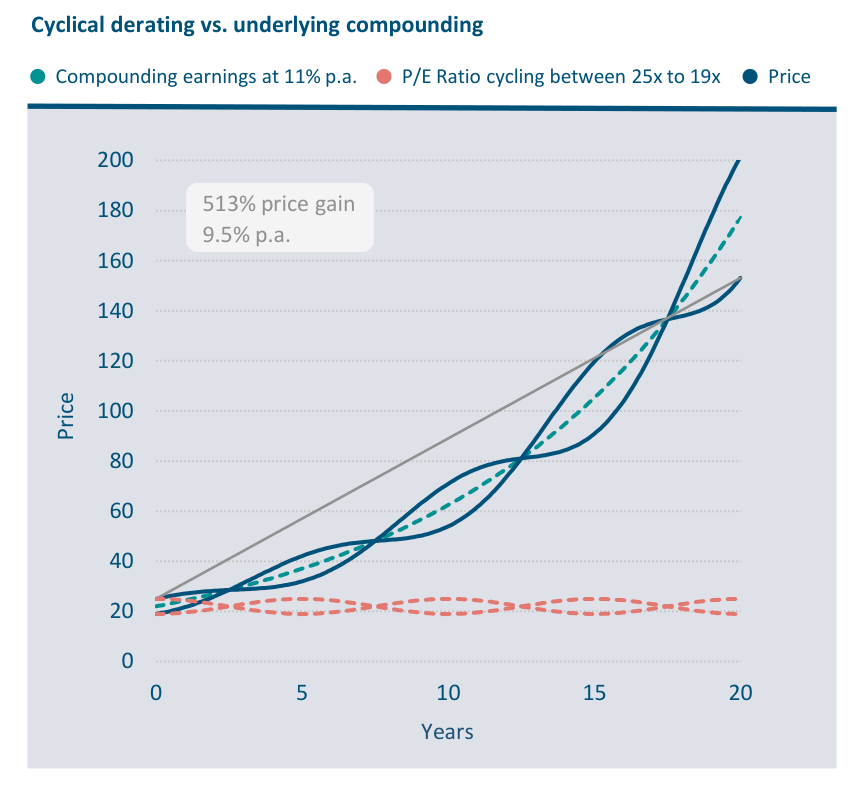
Figure 4: C yclical derating vs. compound growth over a single 20-year time horizon. This is a similar chart to the second panel in Figure 2, with the difference that instead of the P/E declining linearly from 25x to 19x, it cycles sinusoidally between these peaks and troughs with a period of five years (the two pink lines representing two offset phases, as before absent any earnings growth). As in Figure 2, also shown is the uninterrupted compounding of earnings or dividends at 11% p.a. (represented by the green dashed line, absent any ratings change), whilst the two blue lines illustrate the respective impact of all of this on price. Buying at the peak 25x multiple and selling 20 years later at the 19x trough (the grey line connects this trade) again results in the same 9.5% p.a. price return (or a cumulative 513%), regardless of what has happened in between. However, switching repeatedly between investments every five years slashes this return to 5.1% p.a. (or a cumulative 169%); the same result as simply repeating the five-year investment from the first chart in Figure 3 over again. |
Equally, P/E ratios don’t typically move in straight lines. They can rise and/or fall dramatically in a single nerve-testing year and these gyrations introduce all sorts of behavioural traps. If a one-year 24% derating is painful, capturing it on the way up is a tempting shortcut to outperformance, with damaging consequences if this is mistimed.
To illustrate how these pitfalls might manifest, Figure 4 offers a further chart, covering a similar 20-year period as the middle graph from Figure 3. Again, we have the earnings compounding at 11% p.a. (the green dashed curve), but this time, instead of the P/E (the two pink lines) falling from 25x to 19x linearly, we have it cycling over five-year intervals between peak and trough. The impact to this on price is given by the blue lines; of which there’s two to show, by way of example, competing possible investments, each identical, but with the cycles offset. Just as in Figure 3, if you were to buy at the highest P/E and sell at the lowest, you would still realise a respectable six-fold gain (9.5% p.a. before dividends). So, nothing much has changed for the true buy- and-holder, agnostic to what the multiple does along the way. Problems can arise however, if you try to outsmart the curves. If for example, you were to change your position every five years, and in each instance timed it similarly poorly (i.e., buying at the peak P/E and selling at the trough), then even with the steady compounding unaltered underneath, your return drops to 5.1% p.a. For an investor focused on underlying business quality that would be galling. Imagine being completely right about your holdings’ ability to compound at 11% over a full two decades, but with mistimed turnover of just 20% p.a. seeing your per annum return drop to less than half this. Over 20 years this means a cumulative return of 2.7x vs. the zero-turnover alternative of 6.1x.
Are investors likely to misallocate so often? To get it wrong all, or even most of the time? Here we venture into psychological factors and conjecture, but I’d argue the Morningstar figures at the start of the note are cause enough for concern. Most people are biased towards confirmation, to embrace the positive feedback of a share price going up. Rising prices (and, with the benefit of hindsight, peak valuations) imply successful approaches and quality companies. These are easy to buy. And as we’ve just shown, when you’re right about the underlying compounding, you can still achieve a good result, even in the face of derating – if you hold onto them.
|
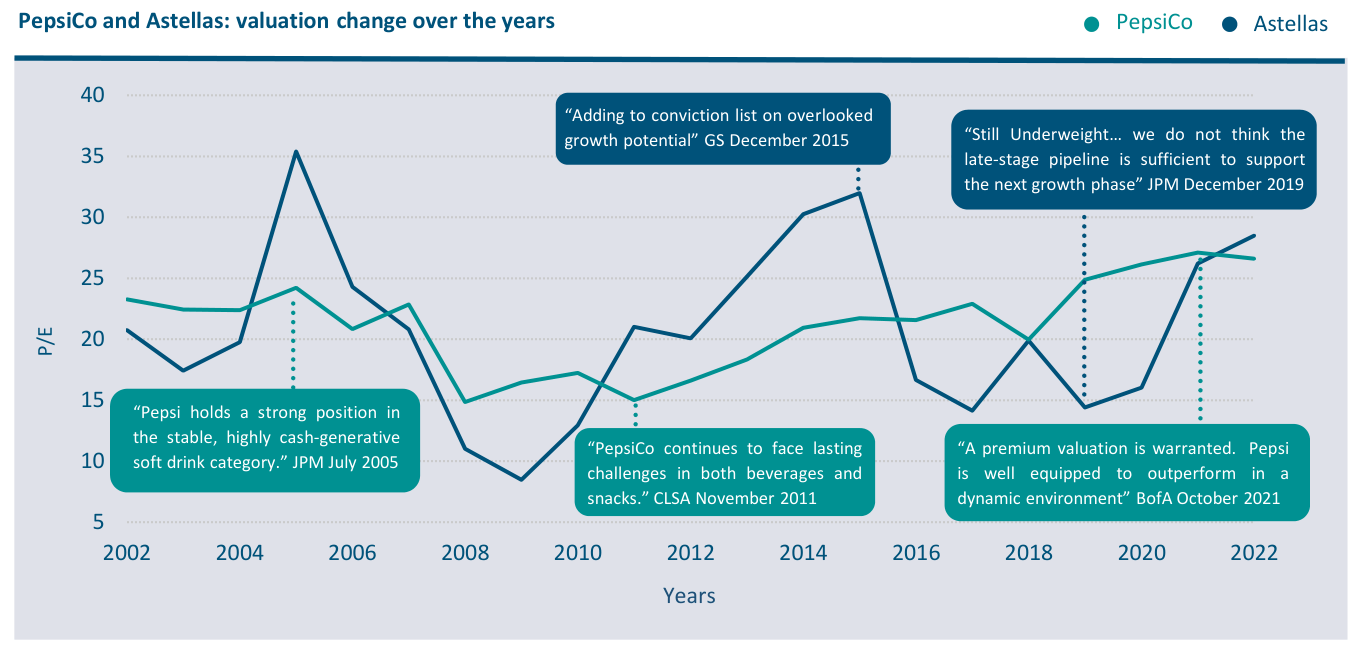
Figure 5: Annual P/E multiples for Astellas and PepsiCo, plotted over a 20-year period with selected snippets of broker commentary illustrating the contemporary and coincident cycles of both valuation and opinion. |
But that may be harder than it sounds. If five years later, the shares are down, and the analyst commentary is negative, it will then be tempting to cut your losses and move back into something ‘better’ without the baggage of half-a-decade’s underperformance. These companies are easy to sell. Do this a few times and you’re locked into a cycle of repeating the mistake. None of this means it is never right to transact, but with a long-term approach, I suggest thinking hard before doing so. Impatient drivers who continually change lanes rarely make much progress.
Does this cycling happen in real life? Perhaps not so symmetrically as to make it predictable, but the magnitude and frequency of these swings certainly aren’t unusual. Figure 5 shows 20 years’ worth of P/E multiples for two of our holdings; Japanese pharma company Astellas, and US drinks and snacks giant PepsiCo. Both we deem high quality companies, and both have compounded their dividends per share at double digit rates over this period. But as you can see, their valuations have swung repeatedly along the way, and not always in sync. In the speech bubbles are some cherry-picked samples of the analyst coverage from the time, indicating (anecdotally) the general mood surrounding these companies as their ratings have shifted. It wouldn’t be hard to follow the crowd here into damaging trading.
But whilst you really do require resilience to cut through all the noise out there, the results can be well worth it, with Figure 6 a final example to illustrate the point. WWE (now TKO following its recent combination with Endeavour’s UFC franchise), has been one of our noisiest stocks. Over more than a decade of ownership, from our Global Representative Account’s inception to the company’s merger last September, we’ve waited through three separate multi-year periods with no return at all. Each time suffering significant underperformance vs. the MSCI World. And yet overall, it has been one of our best performing holdings, delivering a near 15-fold GBP total return. It’s been a rewarding, if bumpy ride, and whilst timing the ups and downs might have amped returns even further, the (in my view unnecessary) risk borne in doing could easily have undone this happy result. As Buffett says, “When you find a truly wonderful business, stick with it. Patience pays, and one wonderful business can offset the many mediocre decisions that are inevitable.” We very much agree.
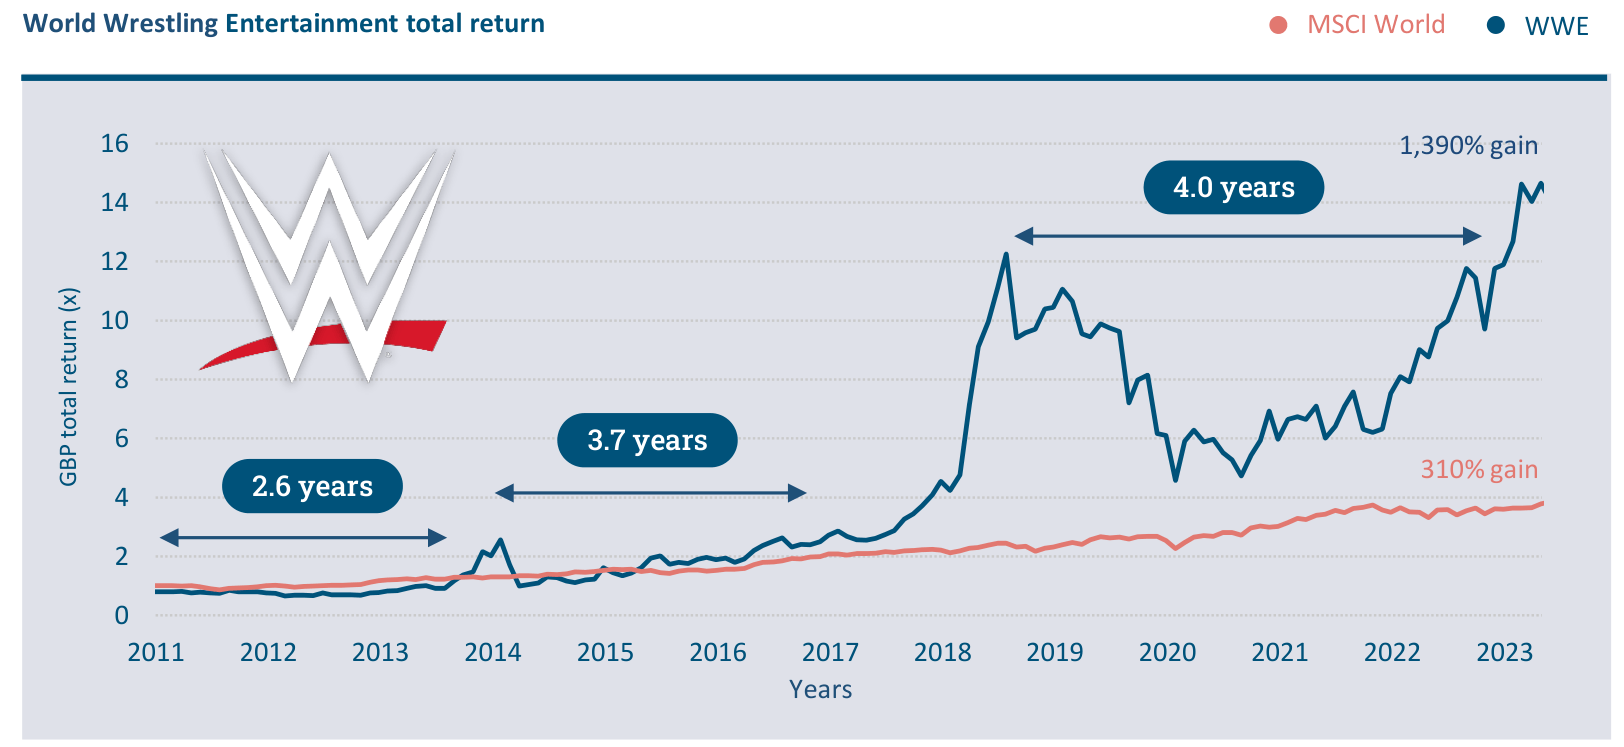
| Figure 6: GBP total return chart for WWE as an independent entity over our holding period from March 2011 to its merger with UFC to create TKO in September 2023. Note three separate multi-year periods generating negative returns, but the strong overall outperformance vs. the MSCI World. |
James Bullock,
Portfolio Manager, Lindsell Train Ltd
|
Footnotes ¹Buffett’s example used 6.5%, whilst the sixth edition of Stocks for the Long Run calculates the ‘Siegel number’ at 6.9% real. Either way, some dispute the congruency of the figure, notably Edward McQuarrie whose 2023 paper revises the source material back to 1792 to identify distinct performance regimes. Similarly, for those with a global perspective, Siegel’s focus on readily available US data connotes survivorship bias. As Ray Dalio documents in his book Principles for Dealing with the Changing World Order, if you look far enough back, most other markets have suffered serious multi-decade losing streaks, with many wiped out by devaluation. ²According to Morningstar, as of July 2023, the average US mutual fund holder earned 1.7% less than their underlying funds over the preceding decade, with passive and active US equity investors lagging by 1.4% and 0.2% respectively. As Morningstar put it, “This shortfall, or gap, stems from poorly timed purchases and sales of fund shares, which cost investors nearly one sixth the return they would have earned if they had simply bought and held”. Does activity subtract value more generally? Several studies suggest a correlation between higher turnover and poor performance (e.g., Carhart 1997 or Champagne 2017) with trading fees and market impact cited as culprits. But beyond costs, there is debate as to the impact of turnover on aggregate performance, given each poorly timed purchase presumably corresponds to an equally well-timed sale. It’s beyond our scope to argue that a higher frequency of transactions necessarily leads to a higher error-rate, but it’s possible that certain groups of even ‘sophisticated’ investors may also bias toward value-erosion when transacting and as a result should similarly minimise churn. ³Of course, both portfolios (theoretical and real) could simply have been lucky and a sample size of two hardly proves the superiority of buy-and-hold. However, Siegel’s study does counter a popular view that index performance relies upon new entrants. His original S&P500 portfolio contained no Intel, no Walmart, and no Microsoft, yet until the mid-2010s, delivered five decades of outperformance vs. the updated index. AQR’s Lasse Pedersen offers an additional perspective on passive churn, noting that mechanical changes within an index may ultimately give active management its aggregate edge, given its ability to price-set when transacting and hence add value over a price-taking passive participant. Sources: Warren Buffett 1965, Berkshire Hathaway Annual Report. Jeremy Siegel 2023, Stocks for the Long Run Sixth Edition, McGraw- Hill. Edward F. McQuarrie 2023, Stocks for the Long Run? Sometimes Yes, Sometimes No, Financial Analysts Journal. Ray Dalio 2021, Principles for Dealing with the Changing World Order, Simon and Schuster. David Farber 2013, Everybody Ought to Be Rich: The Life and Times of John J. Raskob, Capitalist, OUP. Warren Buffett 2024, Berkshire Hathaway Annual Report. Morningstar 2023, Mind the Gap. Brad M. Barber & Terrance Odean 2000, Trading is Hazardous to Your Wealth, Journal of Finance. Jason Barr, Fred Smith & Sayali Kulkarni 2018, What’s Manhattan worth? A land values index from 1950 to 2014, Regional Science and Urban Economics. Jeremy Siegel & Jeremy Schwartz 2006, Long Term returns on the Original S&P500 Companies, Financial Analysts Journal. Mark M. Carhart 1997, On Persistence in Mutual Fund Performance, The Journal of Finance. Claudia Champagne, Aymen Karoui & Saurin Patel 2018, Portfolio Turnover Activity and Mutual Fund Performance, Managerial Finance. Lasse H. Pedersen 2018, Sharpening the Arithmetic of Active Management, Financial Analysts Journal. Charlie Munger 2005, Poor Charlie’s Almanack, Donning Company. Warren Buffett 1999, Berkshire Hathaway Annual Meeting. Albert A. Bartlett 1976, The Exponential Function, American Institute of Physics Publishing. Lindsell Train, Forbes, Morningstar, Refinitiv Lipper, Voya Investment Management, JP Morgan, CLSA, Bank of America, Goldman Sachs & Bloomberg 2024. Risk Warning This document is provided for information purposes only and is intended solely for use by professional investors and advisors. Specifically, it is not intended for, and is not suitable for, those who would be categorised as Retail Clients, and it should not be relied upon by private investors. Past performance is not a guide or guarantee to future performance. Investments are subject to risks and may also be affected by exchange rate variations. The investment value and income may go down as well as up. Investors may not get back the amount they originally invested. © 2024 Morningstar, Inc. All rights reserved. The information contained herein: (1) is proprietary to Morningstar and/or its content providers; (2) may not be copied or distributed; and (3) is not warranted to be accurate, complete, or timely. Neither Morningstar nor its content providers are responsible for any damages or losses arising from any use of this information. Opinions expressed whether in general or both on the performance of individual securities or funds and in a wider economic context represents the view of the fund manager at the time of preparation and may be subject to change without notice. It should not be interpreted as giving investment advice or an investment recommendation. No part of this document may be copied, reproduced or distributed to any other person without prior express written permission from Lindsell Train Limited. Copyright Lindsell Train 2024. Please refer to Lindsell Train’s Glossary of Investment terms here. |
Editor’s Note: The summary bullets for this article were chosen by Seeking Alpha editors.

