Robert Way
In this article, I’ll explain why I consider the VanEck Semiconductor ETF (NASDAQ:SMH) to be a preferable choice over the iShares Semiconductor ETF (SOXX).
SMH and SOXX rank first and second-largest Semiconductor ETFs by assets under management (AUM) and share the same expense ratio of 0.35%.
| ETF | Issuer | AUM $B (source: Seeking Alpha) | TER % |
| SMH | VanEck | 19.44 | 0.35 |
| SOXX | Blackrock | 13.32 | 0.35 |
I’m of the opinion that SMH employs a superior selection methodology, resulting in enhanced performance and a more concentrated exposure to leading semiconductor companies.
Moreover, I foresee SMH potentially emerging as an attractive option for dividend growth investors.
Performance
There’s no denying that SMH has consistently outperformed SOXX over both shorter and longer timeframes. As of the current date, year-to-date, SMH has surged by 33%, while SOXX has risen by 19%. These figures provide solid confirmation that the trend favoring SMH is likely to persist.
| SMH | SOXX | Delta SMH SOXX | |
| 3 years | 99% | 70% | +29% |
| 5 years | 337% | 251% | +86% |
| 10 years | 958% | 777% | +181% |
Performance of SMH vs. SOXX (Seeking Alpha)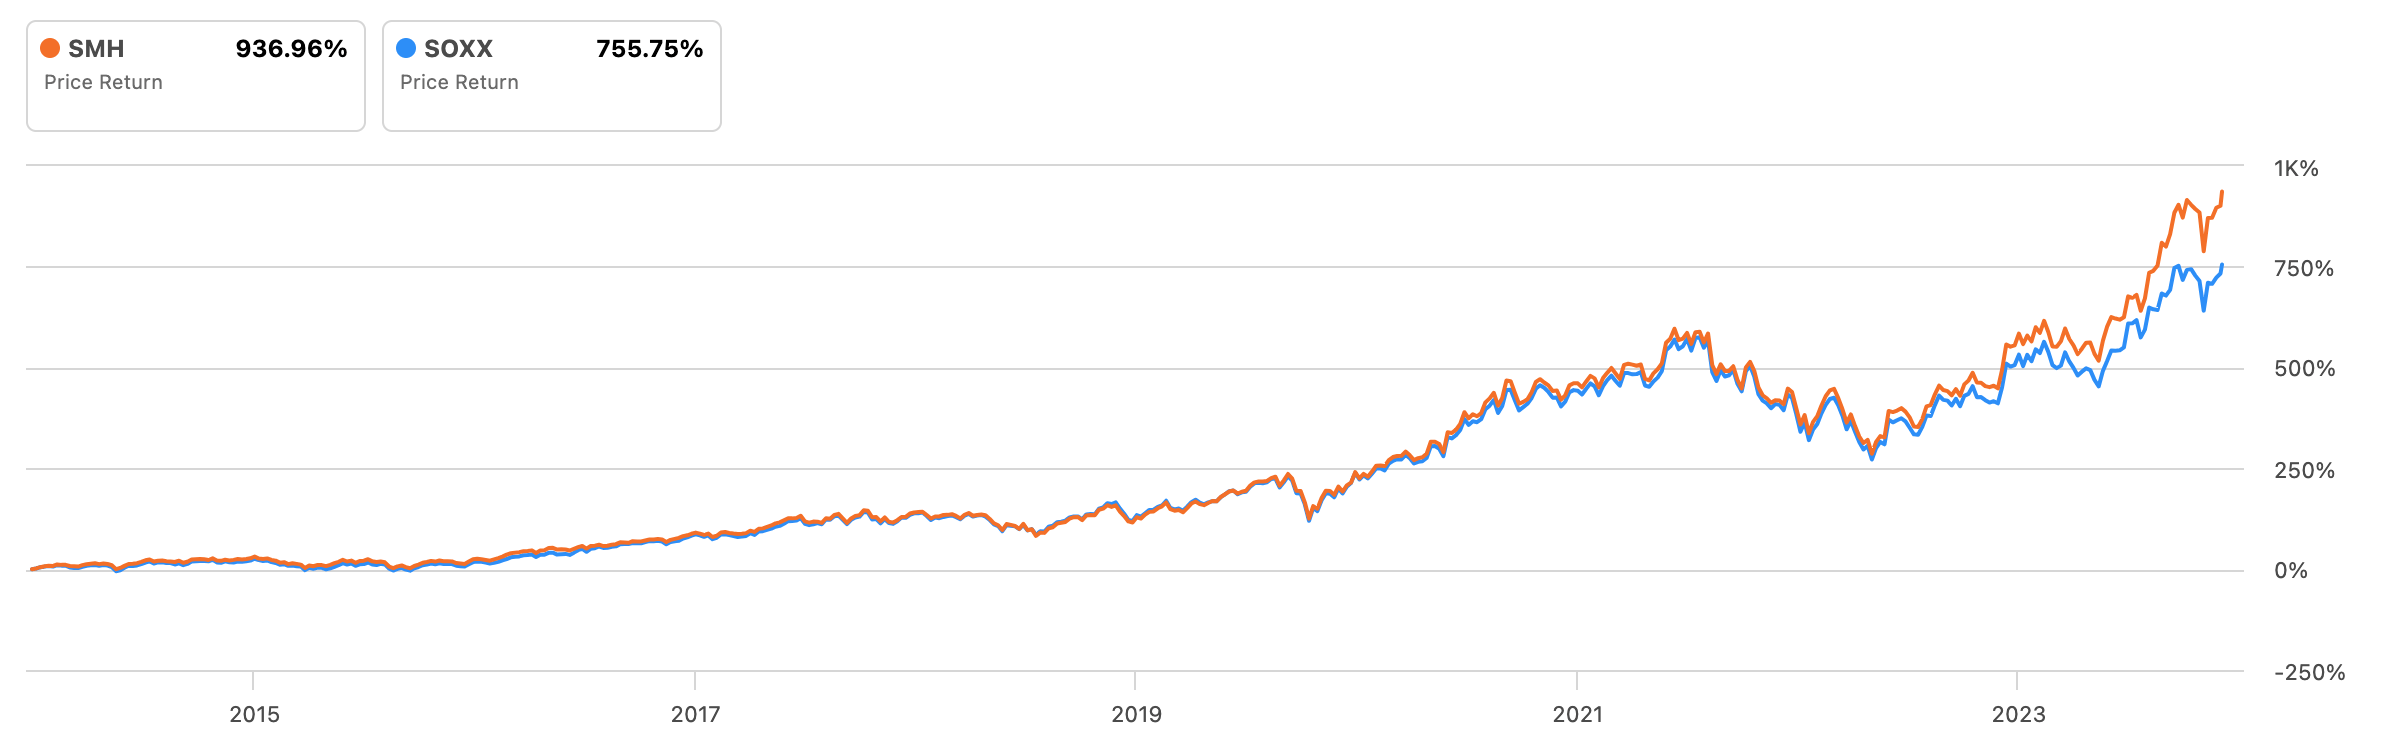
So what is driving SMH outperformance?
Capping Methodology Of SOXX Yields Suboptimal Results vs. SMH
The SOXX ETF seeks to mirror the NYSE Semiconductor Index, which mimics the performance of the 30 largest US-listed semiconductor companies.
This index adopts a market-cap-weighted methodology with a capping system, where the top five securities are capped at 8% each, while the remaining securities are capped at 4% each.
While some argue that this approach safeguards investors by averting excessive concentration in a handful of stocks, there’s limited scientific rationale for capping the top five holdings at 8% and the rest at 4%. This seemingly arbitrary decision, hasn’t yielded clear benefits for ETF holders. Furthermore, such capping is reducing the fund’s growth potential by limiting allocation to high-performing stocks.
SMH Offers A Simpler And Superior Methodology
SMH tracks the MVIS US Listed Semiconductor 25 Index, which monitors the collective performance of the 25 largest and most liquid US-listed companies semiconductor companies, determined by market capitalization and trading volume.
Under this framework, companies are capped at 20%, allowing them to grow without constraints until they reach this threshold. This simple market-cap weighting methodology is the same of the widely popular ETF, the S&P 500 (SPY), which has proven effective over decades (except for the 20% weight limitation).
I find the 20% cap to be a more sensible limit, albeit discretionary, as it prevents any single company from dominating the ETF. It’s worth noting that Nvidia (NVDA) size currently surpasses this threshold, requiring a reduction during the upcoming rebalancing.
I believe that the stricter 8% and 4% market cap limits in the SOXX ETF impose greater constraints, which have hindered the fund’s performance when compared to SMH.
Holding Comparisons
When comparing SMH holdings to SOXX, the first observation is that a significant portion of the companies overlap between the two ETFs.
This implies that opting for SOXX, with its capped weights, only offers partial “protection” against over-reliance on top companies. 22 holdings overlap and 88% of SMH holdings are also present in SOXX.
Overlap between SMH and SOXX (www.etfrc.com)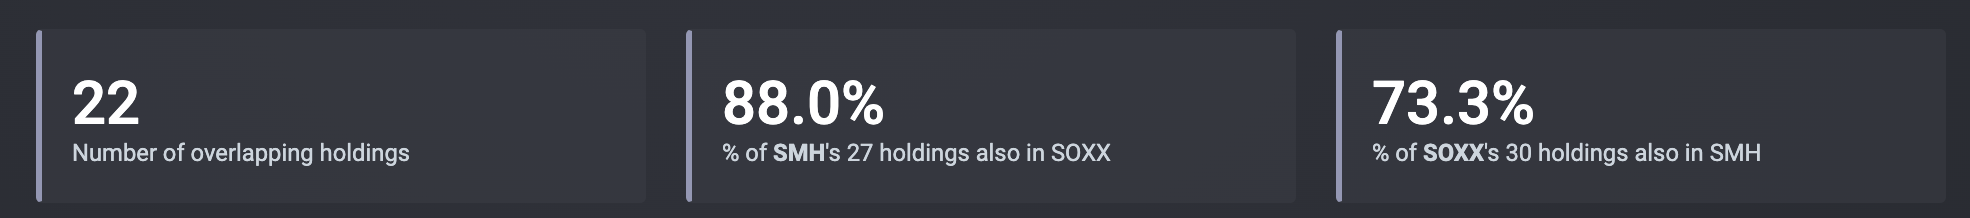
Upon examining companies overweighted in SMH compared to SOXX, it becomes evident that Nvidia and Taiwan Semiconductor (TSM) are the main overweight.
My contention is that it’s advantageous to invest in an ETF that overexposes to these two companies for the following reasons:
Firstly, Nvidia’s exceptional performance warrants a substantial share in a semiconductor ETF. Restricting Nvidia to just 8%, as is the case with SOXX, seems unjustified given its consistent outperformance vs. SP&500 and the semiconductor sector.
Moreover, TSM has emerged as the indisputable global manufacturing hub for semiconductor companies, with over 60% share, so it “naturally” needs to take a larger space in the ETF, mimicking its ever-growing relevance in the real world.
SMH overweight companies compared to SOXX (www.etfrc.com)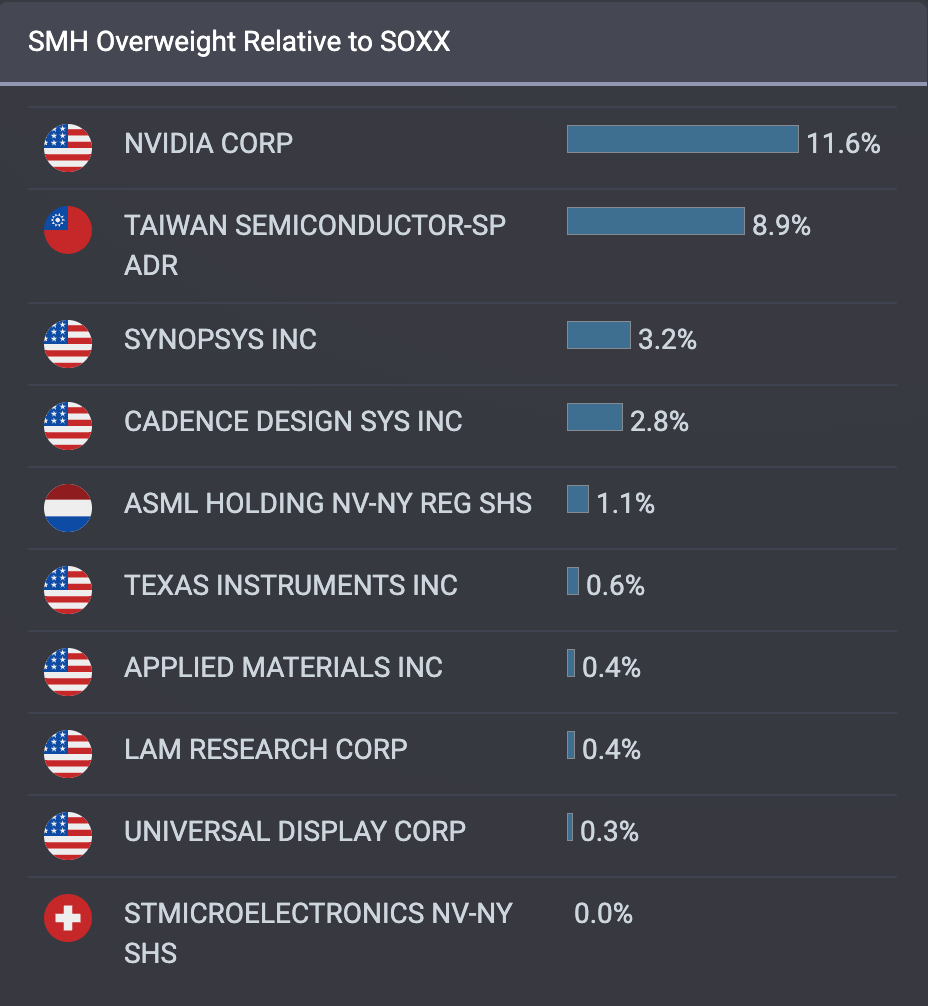
Dividend Growth: An Unexpected Characteristic
When examining Semiconductor ETFs, the focus is often on their impressive returns over the past decade, with dividend considerations often taking a back seat.
A closer look reveals that the First Trust Nasdaq Semiconductor ETF (FTXL) stands out as the leader among the ETFs in terms of dividend growth, boasting an impressive 18% 5-year compound annual growth rate (CAGR).
However, delving deeper, we find that SMH takes the lead in terms of the 4-year average dividend yield, currently at 1.16%. Moreover, SMH’s dividend growth trajectory is on an upward trend, increasing from a 5-year CAGR of 4.95% to an impressive 3-year CAGR of 11.55%.
While there are certainly other ETFs better suited for dividend growth, such as the Schwab U.S. Dividend Equity (SCHD), I believe SMH will pleasantly surprise investors with its future dividend growth potential.
Semiconductor ETFs compared on Dividend (Seeking Alpha)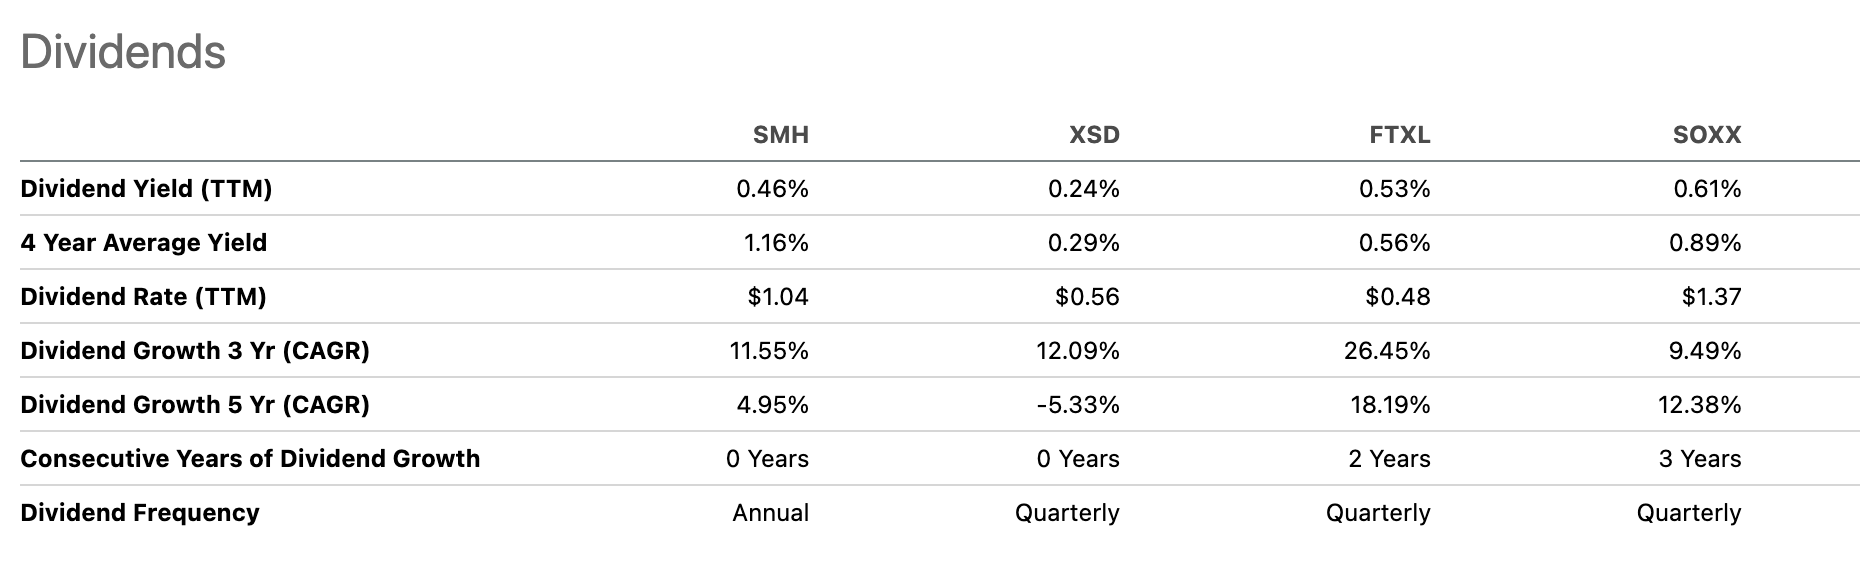
As shown in the table below, eight companies, constituting 48% of SMH, offer dividends that have consistently increased over the past five years, with a minimum compound annual growth rate (CAGR) of 5.23%.
Additionally, four companies, representing 20% of the total weight, have demonstrated robust dividend growth rates of 10% or higher over the same period.
Please take into account that SMH pays an annual dividend whereas SOXX pays its dividend on a quarterly basis and the current yield is higher for SOXX at 0.61% vs. 0.46% for SMH.
Conclusion
SMH presents an exceptional opportunity to access the dynamic semiconductor industry without encountering the constraints associated with the second most popular ETF, SOXX. Moreover, it offers the additional benefit of potential dividend growth. Conversely, SOXX offers inferior performance prospects when compared to SMH, while retaining similar sector risk and holding exposure.
My suggestion is to capitalize on market corrections to acquire more exposure to SMH.

